The Port of Los Angeles is the busiest US container port by TEU volume, followed by Long Beach and New York/New Jersey. This page ranks the top 10 US container ports by full-year 2025 throughput. That’s the most recent data reported by each port authority as of early 2026.
Volumes were mixed across the top 10 in 2025. Los Angeles, Long Beach, Savannah, and Houston all posted growth or record years, while Oakland and the Northwest Seaport Alliance held roughly flat. That’s a sharper split than 2023, when nearly every top port declined together.
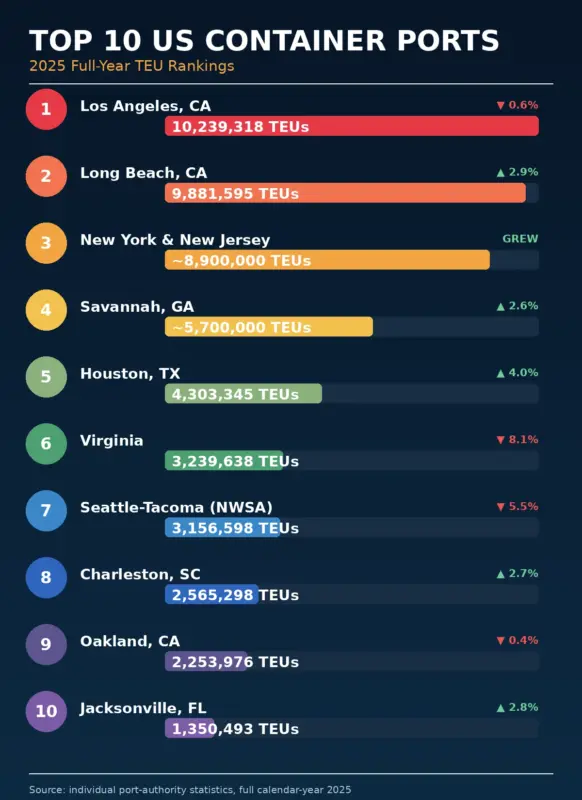
What Are the Top 10 Busiest Container Ports in the US by TEU Volume?
The Port of Los Angeles ranks first with 10.24 million TEUs in 2025, ahead of Long Beach, New York/New Jersey, Savannah, and Houston. Together, these top 10 ports handle roughly 80% of all US container traffic.
“Busiest” and “largest” aren’t the same measurement, though search terms often use them interchangeably. This ranking uses container throughput in TEUs — a 20-foot equivalent unit — not total cargo tonnage or port acreage. Ranked by tonnage instead, bulk-cargo ports like the Port of South Louisiana would top the list.
| Port Rank | Port Name | Container Volume (TEUs) | Data Year | Change vs. Prior Year |
|---|---|---|---|---|
| 1 | Port of Los Angeles | 10,239,318 | 2025 | -0.56% |
| 2 | Port of Long Beach | 9,881,595 | 2025 | +2.9% |
| 3 | Port of New York and New Jersey | ~8,900,000 | 2025 | Grew (exact % n/a) |
| 4 | Port of Savannah | ~5,700,000 | 2025 | +2.6% |
| 5 | Port of Houston | 4,303,345 | 2025 | +4% |
| 6 | Port of Virginia | 3,239,638 | 2025 | -8.1% |
| 7 | Northwest Seaport Alliance (Seattle-Tacoma) | 3,156,598 | 2025 | -5.5% |
| 8 | Port of Charleston | 2,565,298 | 2025 | +2.7% |
| 9 | Port of Oakland | 2,253,976 | 2025 | -0.4% |
| 10 | Port of Jacksonville | 1,350,493 | 2025 | +2.8% vs 2023 |
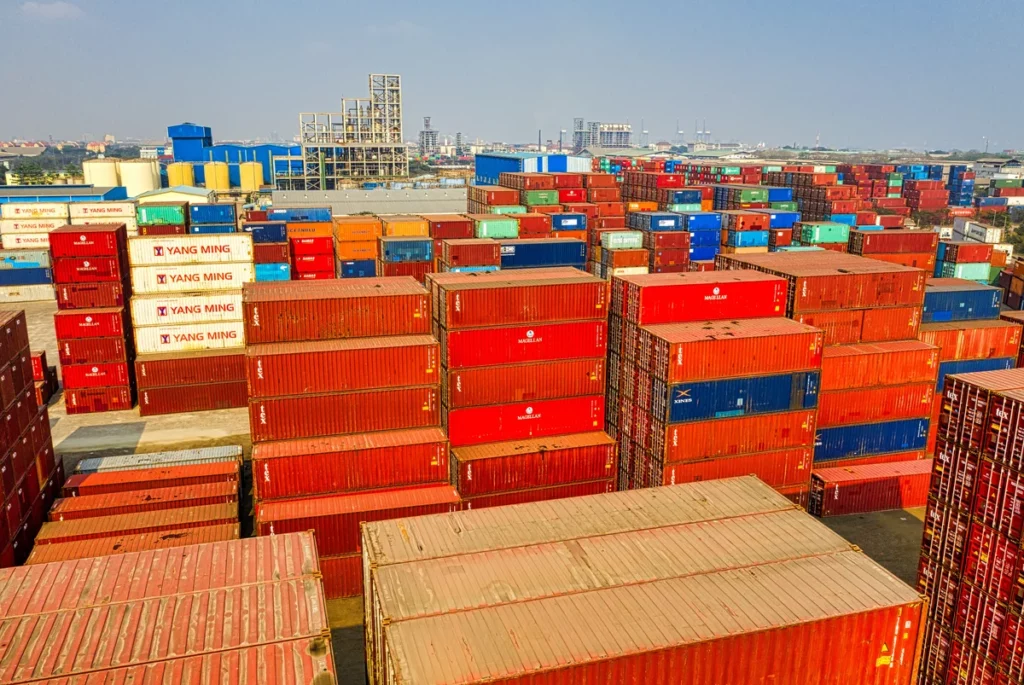
1. The Port of Los Angeles
The Port of Los Angeles sits in San Pedro Bay, 20 miles south of downtown Los Angeles. It remained the busiest US container port in 2025, handling 10,239,318 TEUs — essentially flat, down 0.56% from about 10.3 million TEUs in 2024. That marked just the third time in the port’s history it has topped 10 million TEUs in a single year.
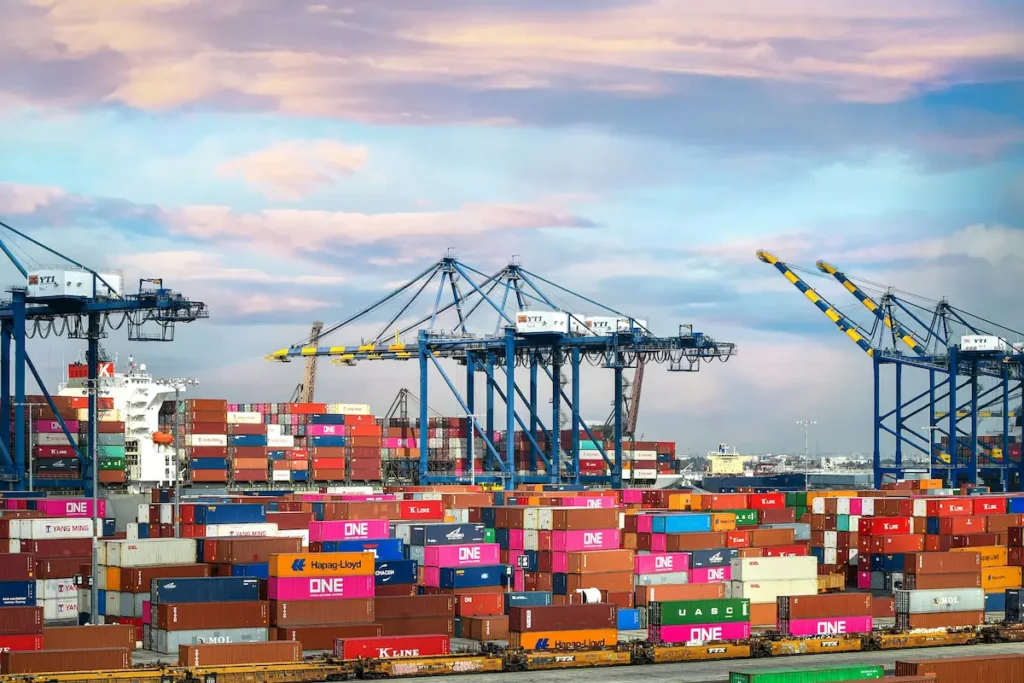
2025 ran hot in the first half and cooled sharply in the second. July 2025 hit 1,019,837 TEUs, up 8.54% year-over-year, while December fell 14.11% to 791,588 TEUs — the steepest monthly decline of the year.
Tariff policy drove that swing. Loaded imports fell 7.9% for the full year compared to 2024, as importers front-loaded cargo earlier to get ahead of new duties. Port leadership had outlined a $2 billion capital improvement program aimed at terminal efficiency and reduced environmental impact.
The port remains the primary US gateway for trans-Pacific trade with Asia. It handles a wide mix of cargo types while continuing environmental programs alongside its core container operations.
2. Port of Long Beach
The Port of Long Beach set a new all-time record in 2025, handling 9,881,595 TEUs. That’s up about 2.9% from the previous record of roughly 9.6 million TEUs set in 2024. Port officials called tariff uncertainty an “immediate” drag on trade planning despite the record.
The port supports an annual trade value of roughly $200 billion and 2.6 million jobs nationwide, including 575,000 in Southern California.
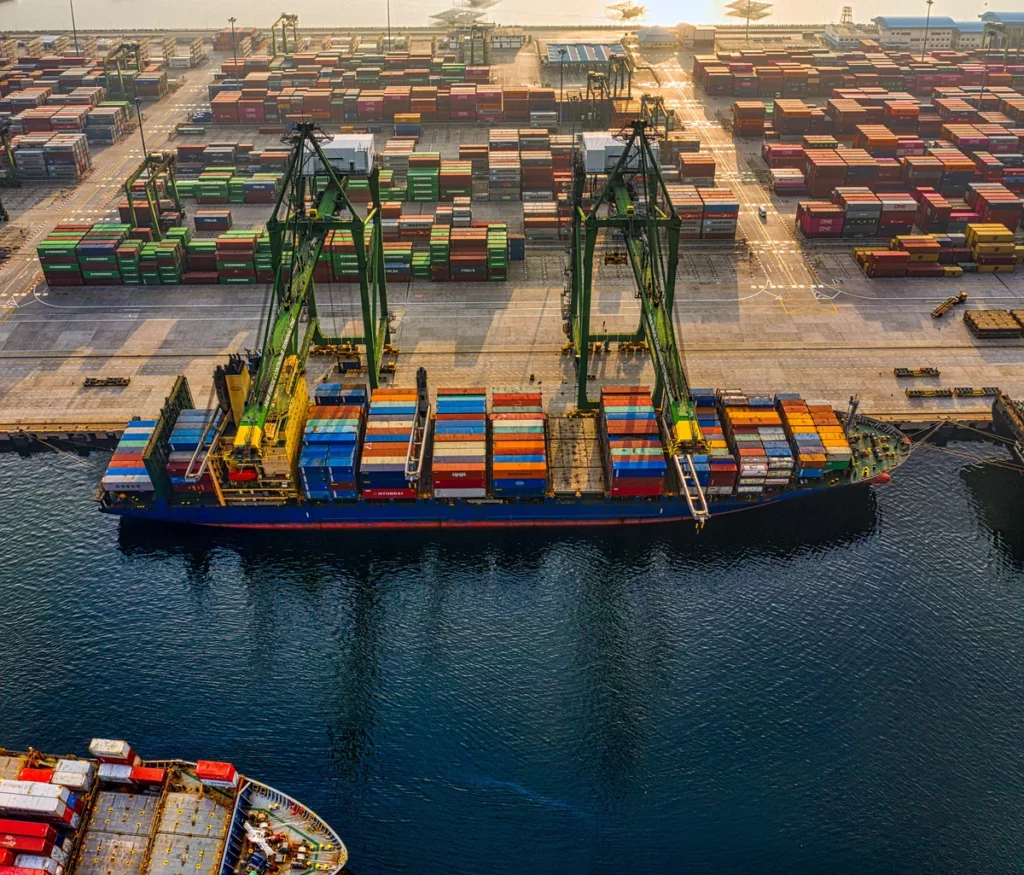
The Long Beach Container Terminal (LBCT) is one of the most automated facilities in the port complex. It runs 10 ship-to-shore cranes, 50 rubber-tired gantry cranes, and 3.3 million TEUs of annual capacity. Careful sequencing during berthing and unberthing at a terminal this size keeps box-per-hour throughput on schedule.
The port’s Clean Air Action Plan and Green Port Policy set targets for cutting emissions and expanding zero-emission cargo equipment. Volume has climbed steadily since the pandemic: 8.1 million TEUs in 2021, 9.1 million in 2022. It reached 9.6 million in 2024, and now 9.88 million in 2025.
3. Port of New York and New Jersey
The Port of New York and New Jersey handled roughly 8.9 million TEUs in 2025, up from 7.81 million in 2023. Full-year imports rose 1.7% and exports climbed 6.5%, even as December volume slipped 5.2% year-over-year.
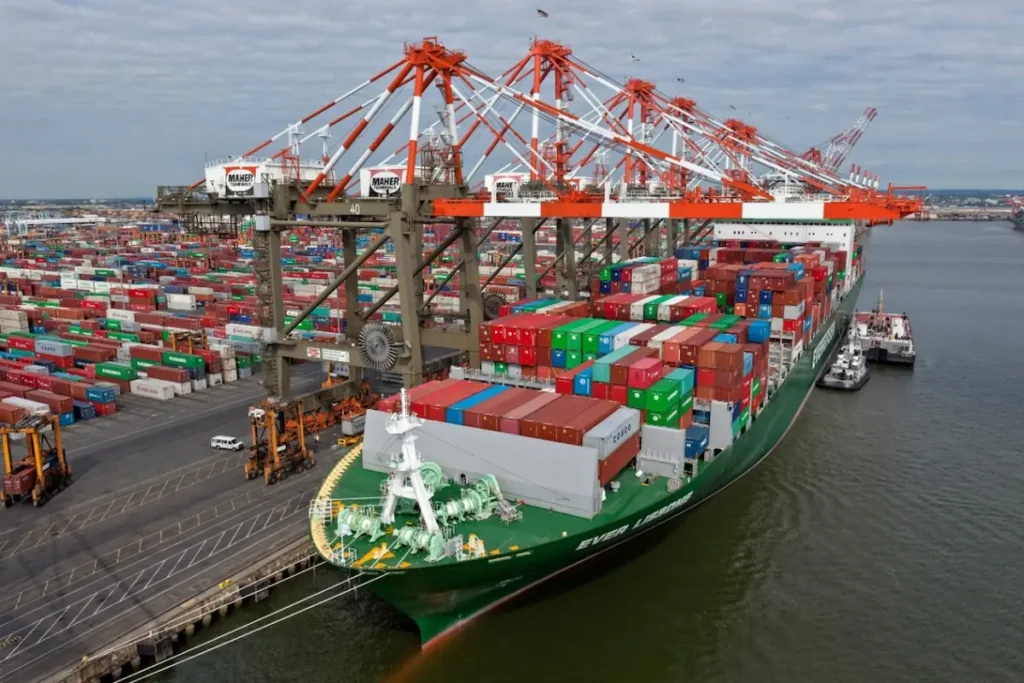
The port finished 2025 as the nation’s second-busiest for loaded containers specifically — a narrower measure than total TEUs that excludes empty boxes. By total TEU volume including empties, it still ranks third behind Los Angeles and Long Beach.
The port remains the primary gateway to the US Northeast, running the Port Newark Container Terminal and the Maher Terminals across its deep-water channels. Its position at the mouth of the Hudson River also makes it the country’s largest oil-importing port alongside its container role.
4. Port of Savannah
The Port of Savannah handled nearly 5.7 million TEUs in 2025, up 2.6% (about 146,000 TEUs) from 2024. That’s its second-busiest year on record behind 2022’s 5.89 million TEUs. It remains North America’s fourth-largest and the East Coast’s second-largest container seaport.
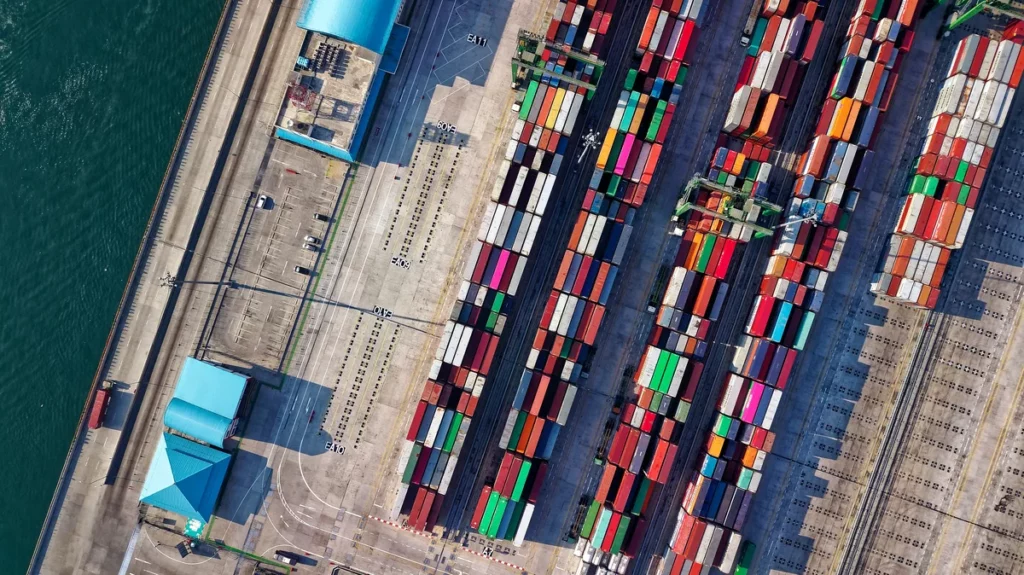
The port is mid-way through a $1.9 billion infrastructure expansion. Key pieces include 1.2 million TEUs of added capacity at Garden City Terminal and 90 acres added to Garden City West. A reopened Berth 1 now takes ships over 16,000 TEUs.
The Mason Mega Rail Terminal, completed in 2022, lifted rail capacity to one million containers a year. That cuts container dwell time and demurrage exposure for inland-bound cargo. A CSX partnership and the Blue Ridge Connector inland rail terminal, due in 2026, extend that reach further.
Hyundai Motor Group’s nearly $6.9 billion EV assembly and battery plant nearby reinforces the port’s role as a regional industrial anchor. The surrounding area saw over 13.8 million square feet of newly leased industrial construction space in 2023 alone. That pace continued drawing distribution and manufacturing investment through 2025.
5. Port of Houston
The Port of Houston handled a record 4,303,345 TEUs in 2025, up 4% from 2024 in its best year yet. It remains the largest container port on the Gulf of Mexico by a wide margin over any competitor.
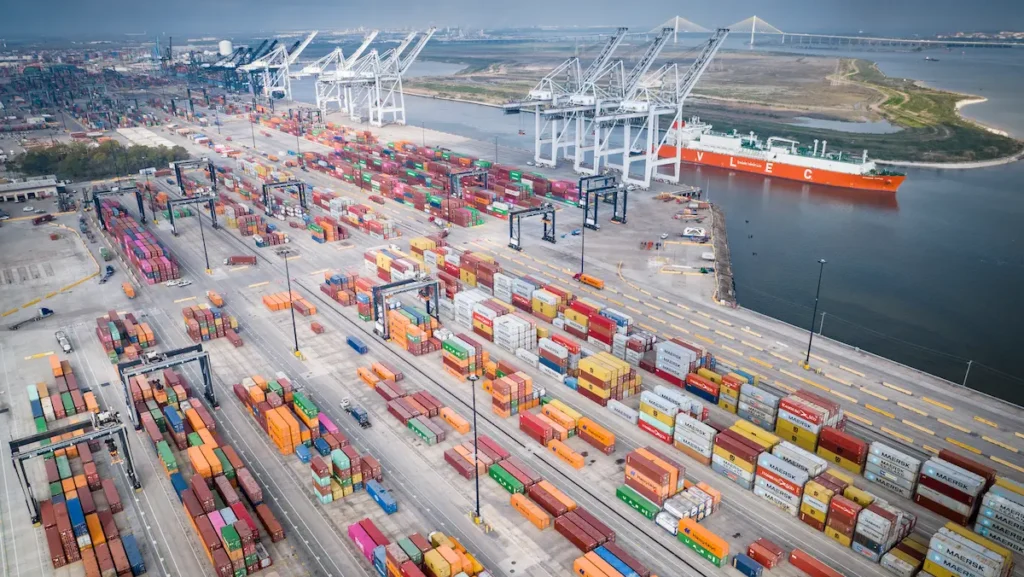
The port supports over 1.35 million jobs and generates more than $265 billion in annual economic activity. Its cargo mix spans chemicals, petroleum, and machinery alongside containerized general cargo.
The Bayport Container Terminal runs automated systems that keep cargo moving efficiently between vessel and rail or truck. The port has also earned a Green Port Award for its work under the Houston Clean Air Strategy.
6. The Port of Virginia
The Port of Virginia held its position as the sixth-busiest US container port in 2025. It moved 3,239,638 TEUs, down 8.1% from a record 3,523,512 TEUs in 2024. That left 2025 volume about 1.5% below the port’s 2023 total of 3,287,546 TEUs.
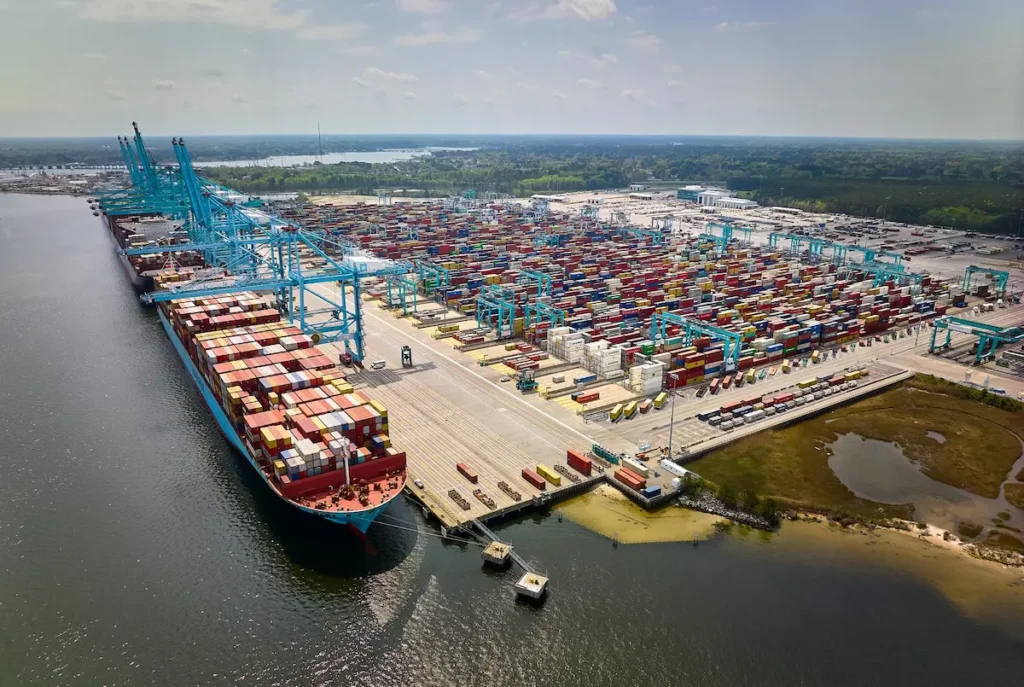
Deep-water channels and unobstructed Atlantic access support three primary terminals: Norfolk International Terminals (NIT), Virginia International Gateway (VIG), and Newport News Marine Terminal (NNMT). Together they handle everything from automotive parts to consumer goods.
The port maintains close working relationships with ocean carriers, shippers, and logistics providers to keep supply chains moving through the region. That combination of diverse cargo handling and carrier partnerships keeps it a key East Coast gateway.
7. Port of Seattle-Tacoma
The Northwest Seaport Alliance, combining the Port of Seattle and Port of Tacoma, handled 3,156,598 TEUs in 2025. That’s down 5.5% from 3.3 million TEUs in 2024. Tariff-driven early ordering and Canadian rail-labor uncertainty had pulled cargo forward that year, and 2025 volume settled back toward trend.
The alliance is a key Pacific Northwest gateway for trade with Asia, supporting over 58,000 jobs. Four major container terminals run 13 post-Panamax cranes capable of handling some of the largest container ships afloat.
Ongoing projects include the Terminal 5 modernization for larger vessels and the Terminal 18 redevelopment for added cargo capacity. Shore power and cleaner-fuel adoption continue to lower the alliance’s environmental footprint.
8. Port of Charleston
The Port of Charleston, South Carolina, ranked eighth among US container ports in 2025. It handled 2,565,298 TEUs, up 2.7% from 2,497,142 TEUs in 2024. It’s also a major hub for automobile imports and exports.
The port supports over 187,000 jobs and generates more than $17 billion in annual economic activity. Its Wando Welch Terminal, the port’s largest, runs 13 ship-to-shore cranes, 52 rubber-tired gantry cranes, and on-dock rail for efficient cargo transfer.
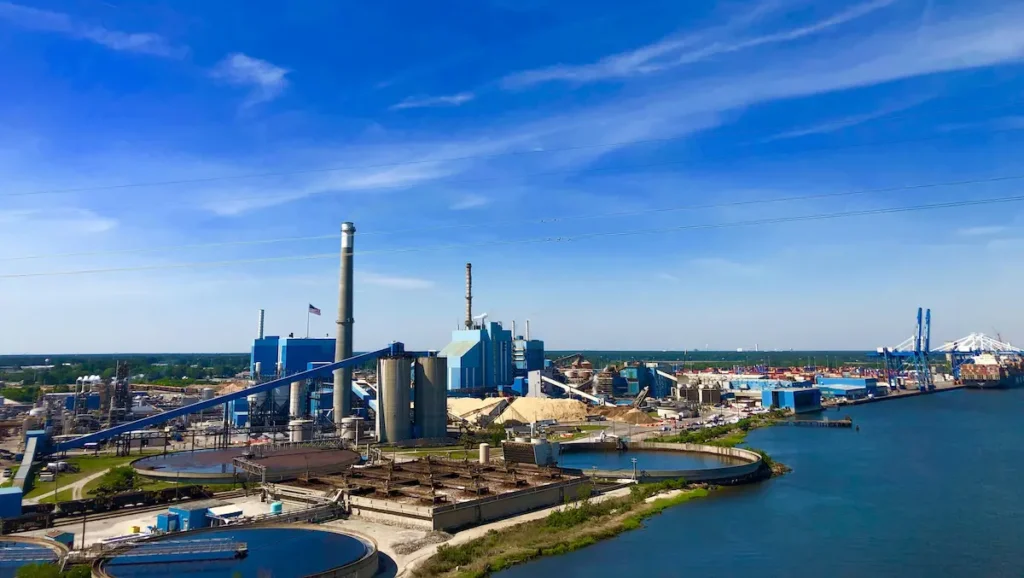
The Hugh K. Leatherman Terminal, opened in 2021, was the first new US container terminal built in more than a decade. It runs five ship-to-shore cranes and 25 hybrid rubber-tired gantry cranes, among the most technologically advanced equipment on the East Coast.
9. Port of Oakland
The Port of Oakland handled 2,253,976 TEUs in 2025, essentially flat at -0.4% from 2024, keeping it the ninth-busiest US container port. Its San Francisco Bay Area location remains central to exporting agricultural products, wine, and technology goods.
Crane-heightening projects and a new rail yard are positioning the port to handle larger vessels and improve intermodal connections. Electrifying cargo-handling equipment and a truck management program continue its sustainability push.
10. Port of Jacksonville
JAXPORT handled 1,350,493 TEUs in 2025, up 2.8% from 1,313,487 TEUs in 2023 — the port’s last previously confirmed full calendar year. JAXPORT typically reports on an October-September fiscal year, but this total reflects actual January-December 2025 volume.
Beyond container handling, JAXPORT added another cruise line to its existing Carnival Cruise Line service. The move signals growing appeal in the cruise sector alongside its cargo business.
The port is advancing its 2020-2025 Strategic Master Plan, which emphasizes diversification across cargo types and trade lanes. That includes new container services with Asia and Europe. Recent investments in eco-friendly cargo-handling equipment support that long-term growth plan.
What Do the 2025 Statistics Show About US Container Ports?
Los Angeles, Long Beach, Savannah, and Houston all grew or set records in 2025. Tariff policy still pushed importers to front-load cargo early in the year and pull back later. That’s a sharper split than 2023, when nearly every top port declined together.
The Port of Los Angeles and Port of Long Beach together now handle over 20.1 million TEUs a year. That volume keeps San Pedro Bay the country’s primary trans-Pacific gateway.
The Port of New York and New Jersey holds a similar role for Atlantic and Northeast trade. It edged past Long Beach on loaded containers in 2025.
Every port on this list is running active capacity or automation projects, from Savannah’s rail expansion to Long Beach’s terminal upgrades. That positions each to absorb further volume swings as tariff policy continues to shift shipping patterns.
What is the busiest container port in the United States?
The Port of Los Angeles is the busiest US container port, handling 10,239,318 TEUs in 2025. It has held the top spot for most of the past two decades.
What is the largest container port in the US?
By container throughput, the Port of Los Angeles ranks largest, with Long Beach and New York/New Jersey close behind. Ranked by total cargo tonnage instead of TEUs, bulk-cargo ports like the Port of South Louisiana would rank higher.
Is the Port of Long Beach or the Port of Los Angeles busier?
Los Angeles is busier, handling about 358,000 more TEUs than Long Beach in 2025. The two adjacent ports share San Pedro Bay and together moved over 20.1 million TEUs that year.
Which US port is the largest oil-importing port and third-largest container port?
The Port of New York and New Jersey holds both titles. Its location at the mouth of the Hudson River, spanning two states, supports crude-oil imports alongside roughly 8.9 million TEUs of container traffic in 2025.
Does Seattle or Tacoma handle more container traffic?
The two ports report combined volume through the Northwest Seaport Alliance rather than separately, so individual TEU totals aren’t published. Together they moved 3,156,598 TEUs in 2025.
Is JAXPORT bigger than the Port of Savannah?
No. The Port of Savannah handled nearly 5.7 million TEUs in 2025, more than four times JAXPORT’s 2025 total of 1.35 million TEUs.
What does TEU mean, and why is it used to rank ports?
TEU stands for twenty-foot equivalent unit, the standard measure based on a single 20-foot shipping container. Ports report volume in TEUs because vessels carry a mix of 20-foot and 40-foot boxes, and TEU normalizes them for comparison.
How did tariffs affect US container ports in 2025?
Several top ports saw importers front-load cargo early in 2025 to get ahead of new duties, then pull back sharply in the second half. The Port of Los Angeles, for example, posted 8%+ monthly gains through mid-year before December volume fell over 14% year-over-year.

- VLCC Meaning: Very Large Crude Carrier Specs, Owners, Rates – September 21, 2026
- What Is SOLAS? Chapter-by-Chapter Overview and Enforcement – September 9, 2026
- What Is MARPOL? Guide to All Six Annexes and Enforcement – September 9, 2026